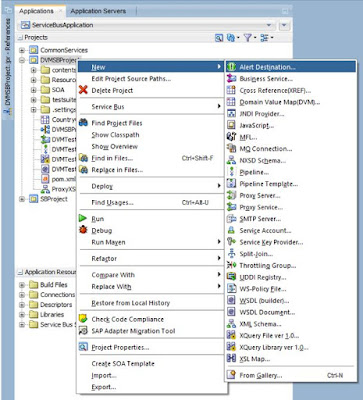
Create a new Alert Destination – to later on send the alerts to:
Set the name for Alert Destination then press Finish:
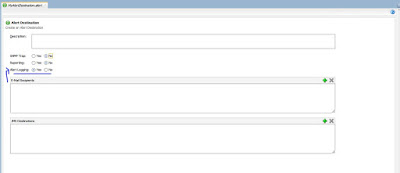
Configure the Alert Destination – ensure that Alert Logging is on. If needed, here we can configure Email or JMS here.
Open the Pipeline editor. Add an Alert activity to the Request pipeline:
Configure the Alert activity as shown here:
The next step is to run the pipeline or the proxy service.
In the Enterprise Manager FMW Control, the Pipelines Alerts can be inspected in the home page for the Service Bus node (that takes the place of the Operations tab). The first tab provides an overview of various types of (recent and aggregate) information.
The second tab provides details on recent as well as not so recent Alerts. On this tab can selected alerts also be purged.
When you click on the alert summary link, a pop up appears with the alert details:
On the home page for the Service Bus Project can we check the services in the project.
We can switch to the Operations tab get a more detailed overview per operation of what operational settings have been made. On this page, the pipeline needs to have Pipeline Alerts enabled in order for pipeline alerts to be produced from it:
If we enable monitoring, the Service Bus will start to collect aggregate information about the number of messages, errors, alerts etc. This information can be reviewed on the Dashboard tab for the Pipeline:


No comments:
Post a Comment