Monday, June 29, 2020

12c SOA - BPEL - Exposed service issue - Showing multiple services or operations including the external called service.

Problem description:
Suppose we have a SOA BPEL service named "LoginTrackingService" which calls an external service named "ABCD" and gets the result and exposes the results. When we are trying to test from em console or open the WSDL in browser . We can see that this service exposes multiple operations and multiple services . In this case, It shows 2 services/operations. one for this BPEL service exposed and 2nd for the called external service but it should have the one exposed service or operation.

Solution:
This is generally happened due to the design mistakes. When we create a BPEL exposed service . It has a exposed WSDL and when we call the external service . It also has a WSDL. This external WSDL reference somehow gets included in the exposed WSDL file. We have to open the exposed WSDL and delete the external WSDL reference from this.

12c SOA - XA DataSource creation in Weblogic console

Implementation steps:
Services⇾Data Sources⇾New⇾Generic Data Source
Provide data source Name, JNDI name
Choose Database Drive. XA and Instances connections.
Next
Provide DB connection deatils Host,port, User name and password and DataBase name i.e, Sid/service name.
Test Connection
Once Connection is success. Next
Choose target manage servers
Activate changes

Open the created data source ⇾ Monitoring tab and test the data source choosing the manage servers.


Wednesday, June 24, 2020

12c SOA -DB Adapter singleton property in High Availability Environment

Problem Description:
There was a problem which one can face in high availability environment (clustered) . The clustered nodes are start polling the data in Parallel mode which leads to poll the same data by all the nodes. Here it is 2 nodes clustered system. so it polls 2 copies of the same data(2 instances with same flow ids).

Solution:
We need to use singleton property in our pooling component / DB Adapter. To enable this feature for high availability environment for a given inbound adapter endpoint, one must add the singleton JCA service binding property in the composite.xml within the <binding.jca> element and set it to a value of true.

Singleton Property in composite.xml
    <binding.jca config="bindin_file.jca">
        <property name="singleton">true</property>
    </binding.jca> 

Now we can see it's polling only one copy of the data.


OSB - Pipeline Alerts

Here we will see how to create pipeline alerts and then locate pipeline alerts produced in 12c Service Bus run time environments in EM console.

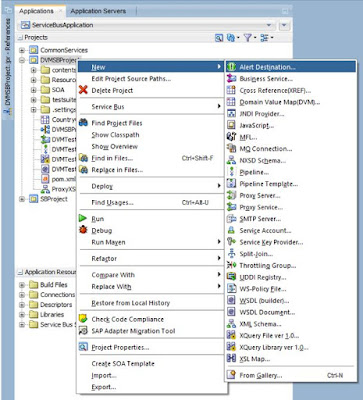
Create a new Alert Destination – to later on send the alerts to:
Set the name for Alert Destination then press Finish:
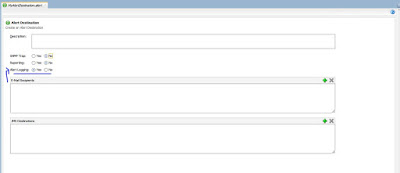
Configure the Alert Destination – ensure that Alert Logging is on. If needed, here we can configure Email or JMS here.
Open the Pipeline editor. Add an Alert activity to the Request pipeline:
Configure the Alert activity as shown here:

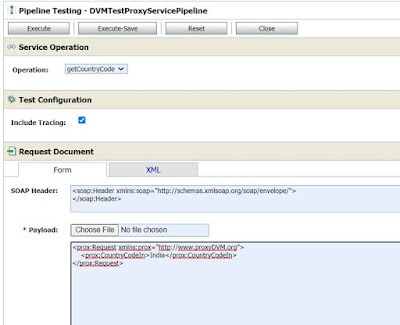
The next step is to run the pipeline or the proxy service. 

In the Enterprise Manager FMW Control, the Pipelines Alerts can be inspected in the home page for the Service Bus node (that takes the place of the Operations tab). The first tab provides an overview of various types of (recent and aggregate) information.

The second tab provides details on recent as well as not so recent Alerts. On this tab can selected alerts also be purged.


When you click on the alert summary link, a pop up appears with the alert details:
On the home page for the Service Bus Project can we check the services in the project.
We can  switch to the Operations tab get a more detailed overview per operation of what operational settings have been made. On this page, the pipeline needs to have Pipeline Alerts enabled in order for pipeline alerts to be produced from it:
If we enable monitoring, the Service Bus will start to collect aggregate information about the number of messages, errors, alerts etc. This information can be reviewed on the Dashboard tab for the Pipeline:


Tuesday, June 23, 2020

12c OSB - Enabling Logging

Here we will see how to add log activity and enable logging settings in EM console.

Topics covered:
  • Enable logging in Global Settings
  • Enable logging at Pipeline level
  • Add log activity to pipeline
  • Message or execution tracing

Enable logging in Global Settings:

Login to EM Console and navigate to SOA⇾service-bus (Admin Server).
Click on Global Settings tab and set Logging Enabled property. We can also enable Monitoring, Alerts, Reporting and Result Cache as shown below.
Pipeline Settings
In EM Console, navigate to SOA⇾service-bus ⇾<<Service Bus Project>>. Go to Operations tab and query for Pipelines. Here we can see all monitoring related properties for Pipelines
Click on Pipeline and go to Properties tab to enable Logging as shown below. We can set other Monitoring and Tracing related properties as well. We can also set log level so that it will be shown in log files.
Add log activity in pipeline


Test 

This logging information is shown in <<osbservername>>-diagnostic.log.


Message or execution Tracing:

Message or execution tracing in Service bus (SB) allows insight into the message exchange between Service bus and it’s communication partners (Client applications and Service providers) as well as the message processing within  a pipeline. Information about incoming and outgoing messages, the corresponding headers, the course of variable manipulations and other things are written to the diagnostic logs and can be inspected there, when the tracing is active. By default the message and execution tracing are disabled, due to performance reasons and so it should only be enabled in development environments for debugging purposes.

Enablement of message tracing for proxy or business service or execution tracing on the pipeline level, can be done using Fusion Middle-ware Control (Enterprise Manager).Under a specific SB project, the corresponding services and pipelines can be found. Enabling the tracing can be simply done by checking the options for message tracing respectively execution tracing in the Operations tab.

Afterwards it should be checked, if the Log configuration on SB level is set to Notification at least. The default configuration for a Default Domain is Warning, which means that no logs are written to the diagnostics logs, even if the configuration on the component level is defined as described before. 


Monday, June 22, 2020

Outlook Web - how to edit or delete rules

To create a rule in Outllok Web Access.

Click New Rule ⇾Click the desired option to select it.

To edit a rule in OWA.

1. Select the rule from the rules window by clicking it.
2. Click Change Rule to open the rule editing window.
3. Make the changes that you want.
4. Click Save to save your changes.

To delete a rule in Outlook Web Access.
1. Select the rule from the rules window by clicking it.
2. Click Delete.
3. A window will pop up asking if you want to permanently delete the selected items.
4. Click OK on the confirmation window to permanently delete the rule.

Outlook Web Access acts on rules from top to bottom in the order that they appear in the Rules window. To change the order of rules, click the rule you want to move and then click the up or down arrow to move the rule to the position that you want in the list.

You can also add an option to a rule to stop processing additional rules against any message that the rule applies to. This is useful if a message comes in that meets the criteria for more than one rule, but you want only one of the rules to be applied.

Edit /Delete steps:


Thursday, June 18, 2020

12c OSB - Message reporting

Here we will see how to use report and track from em console.

Steps:
Open the pipeline and drag and drop Report into a stage.


Provide the Content, Key name, variable as body and xpath for the key.

Deploy the code and test.
Open EM console and SOA⇾Service-bus
Service Bus ⇾ Message Reports
Search
You can see CountryName=India  report column. click here and you will get the body messages and other details.

Featured Post

11g to 12c OSB projects migration points

1. Export 11g OSB code and import in 12c Jdeveloper. Steps to import OSB project in Jdeveloper:   File⇾Import⇾Service Bus Resources⇾ Se...